GeoVISTACenter
In this third installment of the semiotics microlecture, Dr. MacEachren introduces the concept of “dynamic variables.”
To learn more, see these papers, available at: http://www.geovista.psu.edu/dl/new_library/library.html
DiBiase, D., MacEachren, A.M., Krygier, J.B. and Reeves, C. 1992: Animation and the role of map design in scientific visualization. Cartography and Geographic Information Systems 19, 201-214, 265-266.
MacEachren, A.M. 1994: Time as a Cartographic Variable. In Hearnshaw, H. and Unwin, D., editors, Visualization in GIS, London: John Wiley & Sons, 115-130.
MacEachren, A.M. 1995: How Maps Work: Representation, Visualization and Design. New York: Guilford Press.
Other links in this video:
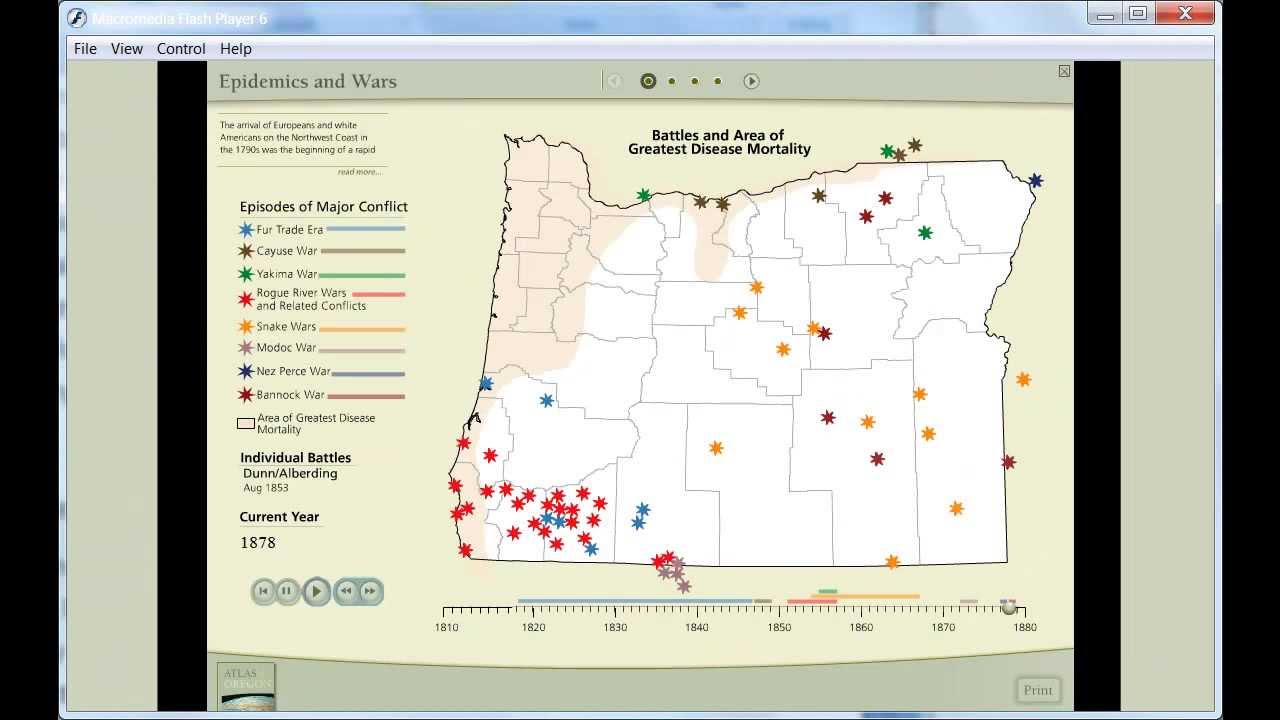
Oregon Digital Atlas: http://infographics.uoregon.edu/projects/atlascd.htm
Frequency: http://en.wikipedia.org/wiki/Frequency
Synthesizer Boot Camp #3 (rate of change example): http://www.youtube.com/watch?v=oaP9hCtVXvE
Please cite this video as:
Alan M. MacEachren, 2010. GeoVISTA Microlecture: Semiotics.03, Intro to Map Signs and Semantics, Video Posted on Youtube, Jan 25, 2010 (video production assistance provided by Krista Kahler). .
