Steuard Jensen
[Note: View in HD to see the graph paper better, or download your own from the link below.]
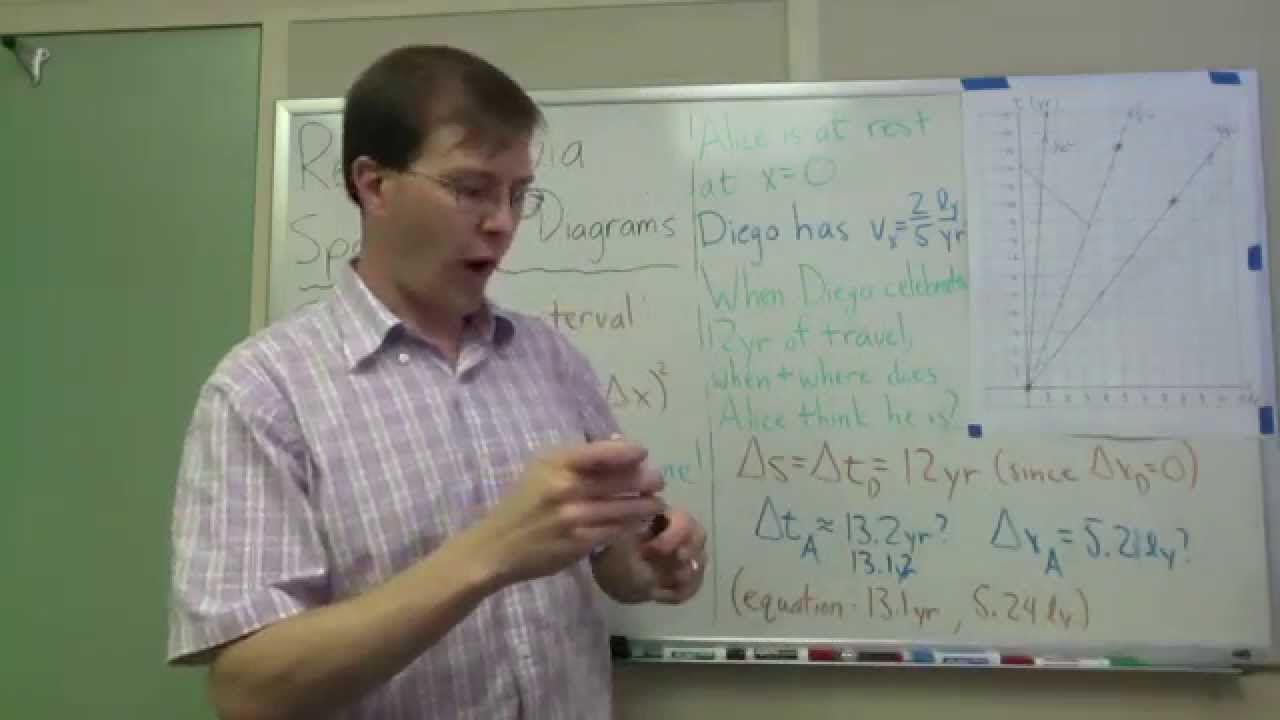
This example shows how to use a space-time diagram on special hyperbola graph paper to estimate a quantitative solution to a time-dilation problem in special relativity, with no equations required. Specifically, given a certain time between events measured by the “moving” observer (relative to the graph frame), we ask when and where the second event will be recorded by a “stationary” observer.
This is a followup to the background introduction found in a previous video: https://www.youtube.com/watch?v=WlmN32XAZ9A The hyperbola graph paper is produced with the HypPrint program created by Tom Moore (http://www.physics.pomona.edu/sixideas/sicpr.html). It’s worth looking at a sheet yourself (“Version 1”): despite my best efforts, the enlarged graph paper in the video is only halfway legible.
Source


Wouldnt the light message sent back to alice be 45 degrees in the negative x direction from Diego's reference frame?? i.e if we made diego's frame vertical, it would be 45 degrees…which would hit Alice much later (approx 17/18 yrs(t))?