PK: An Excel Expert
#PowerBI #ArtificialIntelligence
In this video you will learn about the AI based visuals in Power BI. We have explained below given visuals:
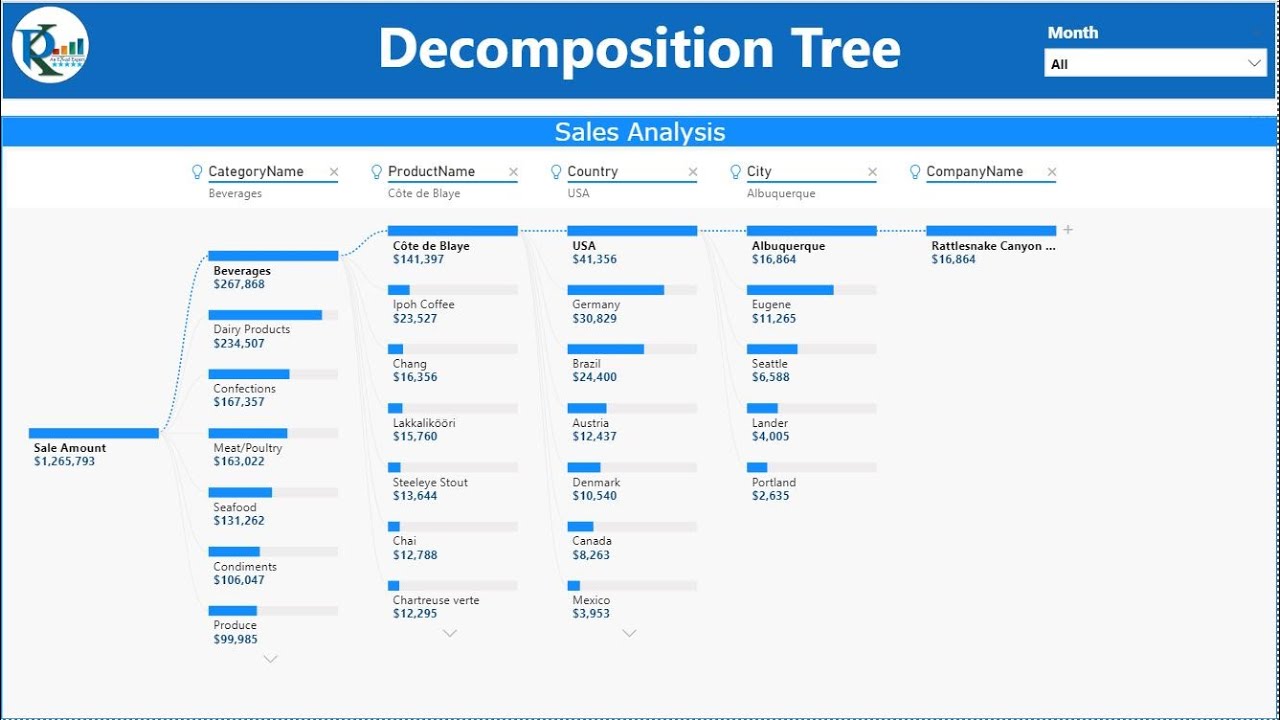
Decomposition Tree: Decomposition Tree is an AI based visual available in Power BI. It lets you visualize data across multiple dimensions. It automatically aggregates data and enables drilling down into your dimensions in any order
Key Influencers: The key influencers visual helps you understand the factors that drive a metric you’re interested in. It analyzes your data, ranks the factors that matter, and displays them as key influencers
Q&A: The Q&A visual can be both used as a tool to allow consumers to quickly get answers to their data, and by designers to create visuals in report by simply double-clicking anywhere on a report and using natural language to get started
Explain the Increase/Decrease: This feature can be used to have Power BI identify and explain the increase or decrease between two data points. For example, perhaps you see a large decrease in sales between two months. Rather than performing a manual analysis to explain the decrease in sales, Power BI can perform that analysis for you!
Please download the practice file from below given link:
https://www.pk-anexcelexpert.com/artificial-intelligence-based-visuals-in-power-bi/
Download our free Excel utility Tool and improve your productivity:
https://www.pk-anexcelexpert.com/products/pks-utility-tool-v1-0/
See our Excel Products:
https://www.pk-anexcelexpert.com/products/
Visit to learn more:
Chart and Visualizations: https://www.pk-anexcelexpert.com/category/blogs/charts-and-visualization/
VBA Course: https://www.pk-anexcelexpert.com/vba/
Download useful Templates: https://www.pk-anexcelexpert.com/category/templates/
Dashboards: https://www.pk-anexcelexpert.com/excel-dashboard/
Watch the best info-graphics and dynamic charts from below link:
https://www.youtube.com/playlist?list=PLbDvAYjpWJ7CEAHn-iuGSeLbUtFnYekHr
Learn and free download best excel Dashboard template:
https://www.youtube.com/playlist?list=PLbDvAYjpWJ7CpupRYMRkXSN0L92t7nUuF
Learn Step by Step VBA:
https://www.youtube.com/playlist?list=PLbDvAYjpWJ7BcoaFQD-syOrZzNSLZycwH
Website:
https://www.PK-AnExcelExpert.com
Facebook:
https://www.facebook.com/PKAnExcelExpert
Telegram:
https://t.me/joinchat/AAAAAE2OnviiEk5o1o8i4w
Pinterest:
https://www.pinterest.com/PKAnExcelExpert/
************* Suggested Books *********
VBA: https://amzn.to/2TMMikX
Excel Dashboard: https://amzn.to/2WZi2Fj
Power Query: https://amzn.to/2Ibd7xR
Power Pivot and Power BI: https://amzn.to/2DCg8BB
Exam Ref 70-778 (Power BI): https://amzn.to/2GnWYTN
************* My Stuff ****************
Mic : https://amzn.to/2TLnF88
Video Editor: https://screencast-o-matic.com/refer/cFe0Q6jzoA
Source


Thanks sir
Thanks
Another great video, thank you so much
Gre8 Video
Amazing PK
Thank you
How to create Notification, Reminder using Excel vba (Date) show in From
Good!!! Show.
U r great and explain in details for better understanding. Salute
Wow! Power BI is amazing!
Excellent Job
Even though I know most of the features in power bi however it has given me some more knowledge on how to get insights from the data, thanks